Enhanced utility of AI/ML methods during lead optimization by inclusion of 3D ligand information
 Leo S. Bleicher1*
  Ton van Daelen1 J. Dana Honeycutt1
  Moises Hassan1 Jayaraman Chandrasekhar2
  William Shirley2 Vickie Tsui2
  Uli Schmitz2*
- 1Dassault Systèmes BIOVIA, San Diego, CA, United States
- 2Gilead Sciences, Foster City, CA, United States
AI/ML methods in drug discovery are maturing and their utility and impact is likely to permeate many aspects of drug discovery including lead finding and lead optimization. Typical methods utilize ML-models for structure-property prediction with simple 2D-based chemical representations of the small molecules. Further, limited data, especially pertaining to novel targets, make it difficult to build effective structure-activity ML-models. Here we describe our recent work using the BIOVIA Generative Therapeutics Design (GTD) application, which is equipped to take advantage of 3D structural models of ligand protein interaction, i.e., pharmacophoric representation of desired features. Using an SAR data set pertaining to the discovery of SYK inhibitors entospletinib and lanraplenib in addition to two unrelated clinical SYK inhibitors, we show how several common problems in lead finding and lead optimization can be effectively addressed with GTD. This includes an effort to retrospectively re-identify drug candidate molecules based on data from an intermediate stage of the project using chemical space constraints and the application of evolutionary pressure within GTD. Additionally, studies of how the GTD platform can be configured to generate molecules incorporating features from multiple unrelated molecule series show how the GTD methods apply AI/ML to drug discovery.
1 Introduction
Bringing a new pharmaceutical entity from preclinical discovery to patients is a long arduous process that even today involves substantial trial and error efforts, which is insufficiently reflected in the common conception of the design-make-test-analyze cycle. Besides sufficient modulatory potency toward the desired target, a successful oral drug requires adequate selectivity, absorption, distribution, metabolic stability and lack of toxicity. These properties have a complex dependency on the physicochemical attributes of the molecule. Furthermore, some of the properties have conflicting requirements that make the design process a tedious balancing act, e.g., aqueous solubility is essential for a drug but too much hydrophilicity usually impedes permeability. Thus, the typical drug optimization campaign is a complex multiple parameter optimization process. Another challenge comes from the fact that the data that can be generated for most if not all trial molecules only approximate the in vivo ADME properties. For example, lipophilicity (LogD), aqueous solubility and in vitro microsomal stability can be measured readily, and those parameters are used to model complex in vivo parameters like bioavailability and drug clearance, but in vivo measurements are obtained only for key compounds.
Machine-learning (ML) models have been available for decades (Selassie et al., 2002; Abel et al., 2017; Sheridan, 2019; Muratov et al., 2020) but recent improvements in compute power and learning algorithms (Patel et al., 2020; Bender and Cortes-Ciriano, 2021; Tong et al., 2021) along with the growing amount of data have led to renewed interest, if not hype (Walters, 2022). While definite improvements in the predictive power of the models have been made (Feinberg et al., 2020; Goller et al., 2020; Aleksic et al., 2022), typical error rates are still substantial. For example, Feinberg et al. report that even the best R2 values are −0.8, obtained for chromatographic LogD measurements and the HPLC EPSA values when they used the time split analysis on a large industrial data set from Merck (Feinberg et al., 2020). The median R2 for over 30 ADME assay endpoints was reported as 0.43. Using multiple models in conjunction lowers the probability of any specific molecule to be correctly predicted to exhibit all of the desired properties. A recent analysis by Aleksic et al. (2022) using a large ADME data set at Boehringer Ingelheim showed that general, class-models for most ADME properties can be generated, but that they are most useful for pre-filtering large compound libraries but not for lead optimization. The latter requires more subtle predictions in the midrange of the property functions. The authors specifically emphasized the inadequacy of models to predict in vivo ADME endpoints (Aleksic et al., 2022). While limited predictive power ML-models, used in concert with generic calculable constraints such as MW, number of HBAs, HBDs, aromatic rings, etc., can effectively shape the chemical space for a particular design problem, early ML-model based lead optimization projects typically suffer from poor models of biological activity. By contrast, the traditional structure-based design approach has relied on the analysis of the ligand protein molecular interactions in crystal structures as a measure target engagement. As a result, the combination of using the observed ligand protein interactions with the chemical design space criteria has been at the heart of structure-based design from its inception.
Nonetheless, with the advances described above, structure-based methods are evolving and taking two distinct directions. One approach, exemplified by Schrodinger’s AutoDesigner platform (Bos et al., 2022) aims to exhaustively enumerate molecules in the relevant chemical space at the level of tens of millions using a variety of generative algorithms. These vast libraries are then filtered using layers of “design space criteria” followed by quantitative structure-based methods, including docking, which still leaves potentially thousands of molecules to evaluate. The last pruning step is often carried out via computationally expensive free energy methods, e.g. FEP+ (Abel et al., 2017; Jespers et al., 2021).
The second approach takes advantage of generative methods where molecules undergo iterative evolution under various chemical property criteria in conjunction with ML models as described by Besnard et al., 2012, or via reinforcement learning as exemplified by Iktos\x{2019} Makya Perron et al. (2022) and AstraZeneca’s REINVENT (Blaschke et al., 2020). This approach can be computationally much faster as the generative methods need only enumerate molecules around the space defined by the molecules from the previous iteration and identify those with improved fit against the set property criteria. As enhancing biological activity is paramount to the lead optimization process, the outcome is tightly linked to the quality of the ML-models. In the absence of highly predictive ML-models for biological activity, which in our experience is a common occurrence, we feel the 3D information of ligand protein interactions need to be used within the generative iteration cycles. Here we describe a new iterative molecule optimization method termed Generative Therapeutics Design (GTD) (Honeycutt et al., 2021), where these interactions have become part of the optimization criteria in the form of simple pharmacophore features, either as binary constraints or as a quantitative parameter to be optimized against. The latter could be a pharmacophore fitness function, such as fit values for combined features, shape similarity, or even docking scores.
In this report we briefly describe GTD and demonstrate its utility in a number of settings commonly encountered during a drug discovery project. Our report describes a “simulated prospective study” chosen to allow us to make significant enhancements to the algorithm based on knowing desired outcomes.
Taking advantage of a large spleen tyrosine kinase (SYK) inhibitor dataset, we show that GTD can effectively suggest potent molecules that were withheld from the training set In additionwe demonstrate how features of two unrelated scaffolds can be merged into a new one and one scaffold can be evolved into another known scaffold.
2 Methods
2.1 GTD: Workflow with 2D ML models
The general approach of the GTD application has been described (Honeycutt et al., 2021) and is shown schematically in Figure 1A. Below we review some of the salient points but focus on the capabilities added since our initial publication (see SI for more detail on GTD method).
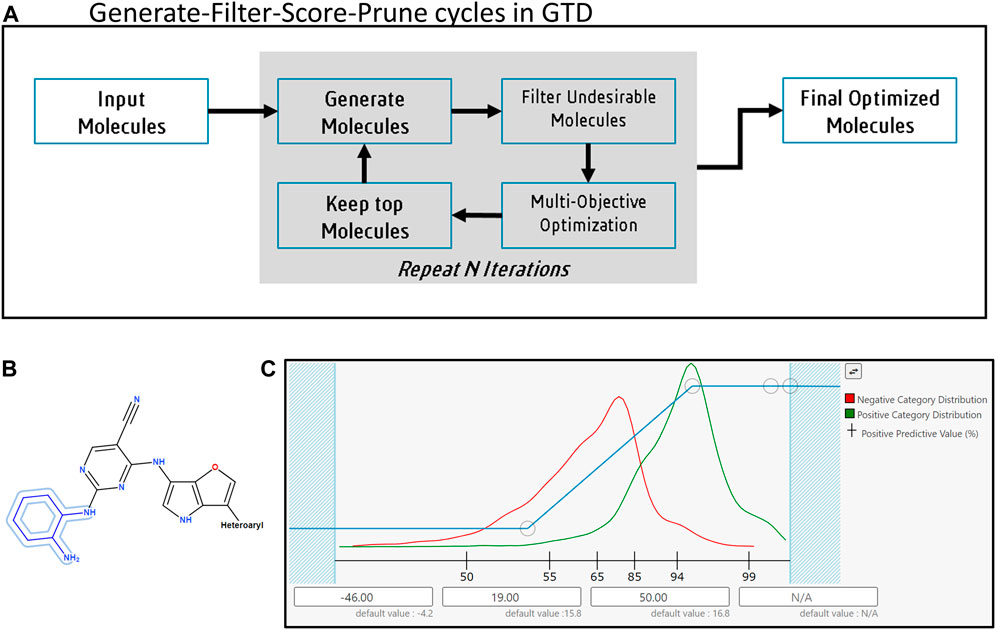
FIGURE 1. The Generative Therapeutics Design platform. (A) The generate-filter-score-prune cycle. (B) Example for Input molecule with fixed atoms and homology groups (Fixed atoms, outlined in blue, are not modified during the molecule generation process; homology groups, like “heteroaryl” or “heterocyclic” impose restrictions on the substituents accepted at specific positions on a core). (C) User interface to setup a desirability function for a predictive model in GTD. Red line shows histogram of scores for training samples labeled as “bad” when the model was created, green line shows histogram of samples labeled “good”. Histograms help user refine GTD suggested desirability mapping function. Circular markers on blue line are user configurable inflection points controlling the mapping of a raw score for a candidate molecule (along X-axis) to a desirability value (Y-axis). X-axis labels show Positive Predictive Value for the predictive model. When no training data results are available GTD generates a histogram of predicted responses from a selection of FDA approved drugs.
The key criteria for a generative design tool are that the candidates proposed by the system be applicable, novel, and feasible. In the arena of small molecule design applicable translates into a balance of potency on target, a sufficient therapeutic index with respect to off-targets including general toxic effects, and appropriate pharmacokinetic properties. Novel molecules are not “trivial” modifications of what was known at the beginning of the process and are not described in the patent literature. Feasibility covers synthetic accessibility, cost, complexity and adherence to rules-of-thumb widely used by med-chemists, e.g., Ro5.
The GTD application employs an iterative, evolutionary approach to identifying molecules meeting the classes of criteria described above. Each iteration involves several stages with the intent of rapidly pruning away unproductive avenues of investigation thus exploring the minimum useful portion of chemical space. Thus, each iteration comprises a Generate-Filter-Score-Prune (GFSP) cycle.
2.1.1 Generate
The first stage of the GTD iterative process is to generate new molecules based on enumeration schemes or molecular transformations. Both sets of methods make incremental changes to an initializing collection of input molecules. In the case of enumerations a random subset of R-groups or reactants forms the initial set. Subsequent iterations retain R-groups or reactants that were found in high performing molecules (as described below), remove ones that were not, and add new ones based on a set of criteria pertaining to group similarity. In the case of user supplied input molecules, these are typically a collection of leads from the project or the literature; here, the user can specify substructures in the molecule(s) that will not be modified and limit the range of possibilities at particular attachment points to specified homology groups (see Figure 1B).
Starting from these input molecules GTD performs a variety of transformations. (See SI for details of the methods.) The breadth of variation produced by these transformations can be tuned for exploratory or refinement stages. These methods are designed to output new molecules that remain constrained to the domain of feasible structures, and are appropriate for drug discovery projects. Various assessments of the chemical space accessible by these transformations are described in the SI and will be the subject of future communications.
2.1.2 Filter molecules
The output of the generative methods above is reduced with a variety of user selectable filters. Of course, different types of drug targets require molecules with different characteristics which can often be expressed in terms of countable or easy to calculate molecular properties. GTD’s suite of chemical filtering capabilities includes intrinsic molecular properties, built in and user defined substructure and fragment quality catalogs, as well as user defined “known molecules”. More details are found in the Supplementary Information.
2.1.3 Score
The purpose of the score stage is to winnow the set of candidate molecules according to the specific objectives as represented by the target product profile (TPP). This typically includes multiple predictions of biological activity and various physicochemical properties. GTD uses 2D ML models to score and then rank molecules according to how well they meet the objectives set by the TPP. Although other approaches are supported in GTD, the current “best practice” approach that we generally advocate uses classification models and assignment of a desirability (D) profile for each element of the TPP. (See SI for further details.) The limitations of this approach using purely data-derived ML models, and how we have modified it when 3D physics-based models are available are described in a later section.
Note that in this “standard” workflow, a molecule is rejected if it falls outside the applicability domain (AD) of any ML model. While there is general agreement that every ML model has an AD, there is less agreement on how exactly to assess whether a molecule is within or outside the AD, with various different approaches proposed in the literature (Kar et al., 2018). In general, descriptors used in assessing the AD are the same ones used to build the model. (See SI for further details.)
Once the AD and other filters have been applied, using the desirability alone to rank the remaining molecules and determine which ones survive an iteration tends to result in sets of molecules with low chemical diversity. This is because molecules with the greatest desirability scores often differ from each other by only small variations. Thus, GTD imposes additional evolutionary pressure to encourage diversity. This helps to both ensure that the final collection of suggested molecules has structural diversity, and to reduce the risk of intermediate iterations becoming stuck in local maxima such that most incremental changes result in “worse” molecules, even though multiple changes could identify superior ones.
Two broad schemes for maintaining diversity are implemented in the GTD system: cluster-based and Pareto-based. In the clustering approach, molecules are grouped into clusters according to one of various alternative criteria, and only one or a few molecules with the greatest D values within each cluster are considered for the final ranking before the pruning step. Clustering by Tanimoto distance, common Bemis-Murcko scaffold, or common scaffold outline (in which all heavy atoms are replaced by carbon) is supported. The alternative to clustering for maintaining diversity in GTD is Pareto optimization, trading off diversity against desirability. See here for a description of this method (Honeycutt et al., 2021).
2.1.4 Prune
Having completed the Generate, Filter, and Score stages, the final step is to prune the often still large set of molecules resulting from those stages into a subset to be used as inputs for the next iteration. Typically, this is done by keeping the number specified by the user (default 100) with the greatest overall desirability scores. If clustering was used, only the top molecules from each cluster are considered in the ranking by desirability. When enumeration-based generation methods are used these top ranked molecules are disassembled to determine the R-groups or reactants that should be reused in the next round of partial enumerations.
2.2 GTD: Modified workflows with pharmacophore models
The ability of a machine learning model to make reliable predictions for substructures outside its AD is limited. Indeed, the standard methodology in GTD is to simply discard any molecule that lies outside the AD for any of the models making up the TPP. In practice, though, it is usually necessary that the process of lead optimization suggests structural motifs that have not been tried before within a project. If such motifs differ too greatly from those found in the ML models’ training data, then predictions cannot be trusted for molecules containing them.
By contrast, a pharmacophore model derived from the 3D structure of ligands bound to an active site would not be expected to suffer the same limitations. Such models are a physical rather than a statistical representation of ligand behavior relative to the target. Consequently, we incorporated such 3D models into GTD optimizations and found substantially increased success relative to the use of 2D ML models alone.
The GTD application supports three different ways to incorporate a pharmacophore (PH4) model into the workflow, all of which we have found useful in different situations. Select features of the Discovery Studio modeling suite (Dassault Systèmes, 2022a) are available in GTD and thus, this implementation of PH4 models was used in this work. In the applications described below, pharmacophoric features employed were Acceptor, Donor, RingAromatic, Shape (of ligand) and ExclusionVolumes (for receptor). In order to evaluate a GTD generated molecule against a PH4 model, proper 3D conformers have to be generated, which must include defining stereoisomers and protonation states. These calculations are carried out using Pipeline Pilot components (Dassault Systèmes, 2022b) with settings based on the standard pharmacophore evaluation protocols found in Discovery Studio (Dassault Systèmes, 2022a).
The supported usage scenarios for PH4 models in GTD are:
1) As part of the Filter step: Molecules for which one or more conformers can be fitted to the PH4 model pass, while others are rejected. The user can define the threshold for pass/fail criteria to increase the quality of PH4 match (default settings: FitValue>0 for combined features, ShapeSimilarity >0.5, both on a normalized scale from 0 to 1).
2) As part of the Score step: The overall desirability, D, from the 2D ML models in the TPP is multiplied by the PH4 fit score. This adjusted desirability score is used for ranking in the Prune step.
3) As part of the Prune step: After an initial ranking and pruning according to the desirability score of the 2D ML models in the TPP, the PH4 fit score is used to re-rank and cull the set further. When using a PH4 model in this way, the Prune step is done in two stages. In the first stage x*n molecules are kept based on the overall desirability, where x is an expansion factor (default 2) and n is the final number of desired molecules. These molecules are then run through the PH4 fitting. Scores from the PH4 model are then used to re-rank the molecules, and the top n are retained as inputs for the next iteration.
Specifics of how we used PH4 models for the SYK inhibitor study, including modified workflow involving the gradual enablement of filters are discussed below.
2.3 SYK inhibitor data set
SYK is a cytoplasmic tyrosine kinase and an important mediator of immunoreceptor signaling. A plethora of drug discovery efforts in multiple therapeutic areas have been described (Liu and Mamorska-Dyga, 2017; Tang et al., 2022) including the discovery stories of entospletinib and lanraplenib (Currie et al., 2014; Blomgren et al., 2020). For an apt account of the clinical progress see the following reviews (Liu and Mamorska-Dyga, 2017; Tang et al., 2022).
Table 1 shows the key biological activity data (biochemical kinase assay: SYK IC50; cellular activity: pBNLK EC50; whole blood cellular activity: hWB CD63 EC50) along with metabolic stability in human hepatocytes and the kinetic solubility at pH7. Entospletinib emerged from hundreds of compounds as an early clinical SYK inhibitor that had to be dosed orally twice a day at 400 mg due to poor metabolic stability and low micromolar solubility at pH7. A back-up program for a once daily compound was launched in which almost another 1000 compounds were synthesized and evaluated. The TPP for this effort is also shown in Table 1. While the discovery of the oxetano-piperazine instead of the morpholine moiety furnished many metabolically more stable compounds, finding a replacement for entospletinib’s indazole proved difficult in that the SAR of the cell-based activity, solubility and permeability was idiosyncratic. Introduction of two non-adjacent nitrogen heteroatoms into the indazole moiety and its analogs started the final phase of the project leading to lanraplenib. The vast majority of the final 91 compounds contained the pyrazine substructure as seen in lanraplenib.
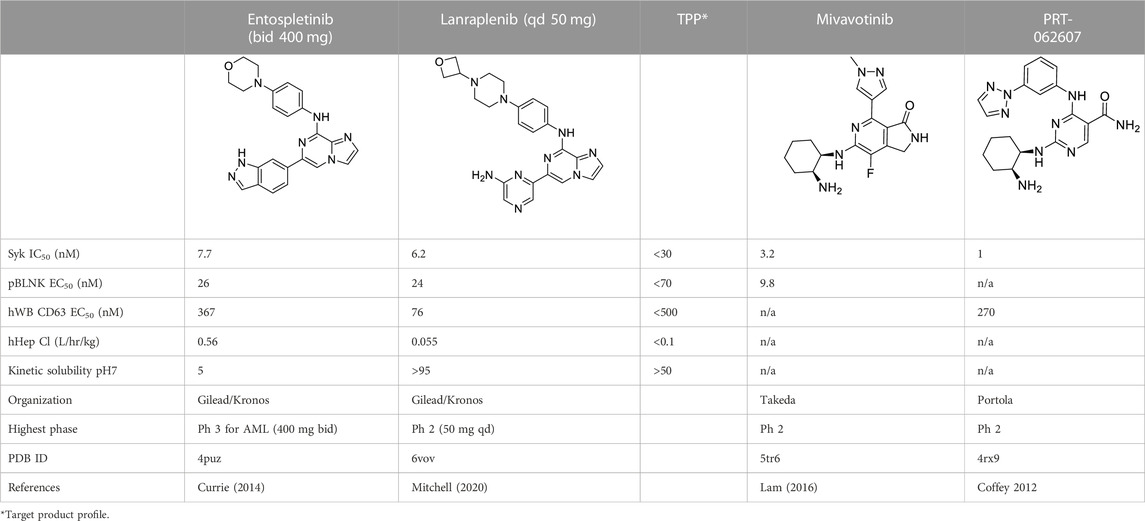
TABLE 1. Clinical Stage SYK inhibitors used in this study.
To test the utility of GTD we used the SAR data for those compounds that did not contain the “final” pyrazine motif, leaving a total of 1655 compounds for model building and 91 compounds for validation (number of data points for training each model are listed in Table 2).
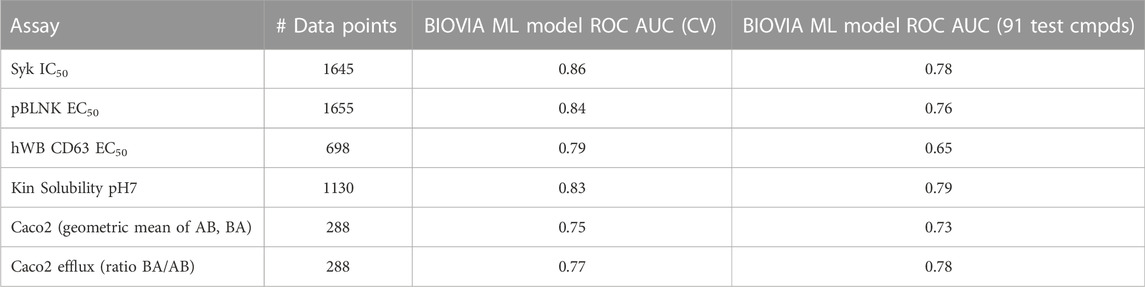
TABLE 2. Statistics for 2D ML-models.
This training data was used to generate 2D ML-models as described above. Note that the 91 compounds in the validation set were not a random subset of all the compounds but instead were selected to omit information discovered late in the candidate identification process, thus roughly representing a time-based split (Sheridan, 2013).
3 Results
3.1 Application of GTD for finding high value analogs during lead optimization
Standard usage of GTD would entail the application of 2D ML-models built on existing SAR data along with project specific or global physicochemical property ML-models along with other design space filters as described above. One desired usage scenario would be for GTD to generate new ideas that pass all filters and score high in the ML-models when a lot of data exist, like in the situation of the SYK inhibitor project team right before the pyrazine moiety was discovered.
To simulate this situation, random forest classifier models were built for three biological activity assays, solubility and permeability using the methodology described above. The resulting model quality measures are shown in Table 2. While the overall quality for all models was good when just considering the training set, most ROC AUC values dropped significantly, especially for biological activity, when just the final 91 compounds were predicted. But most importantly, many of the best of the final pyrazine compounds were predicted to be inactive in one or more of the activity models. Not surprisingly, GTD did not generate compounds with the pyrazine moiety or anything that would have been appealing for the project team to pursue. Nevertheless, empirical testing of GTD molecular optimization using these models revealed two problems:
1) The AD for the models built from the fewest data points was so restricted that a majority of the 91 validation compounds were rejected as outside the AD when all ML models were used in the TPP. In particular, because none of the training compounds included any pyrazine-containing compounds, any appearance of this moiety in compounds produced by the Generator would have been rejected.
2) When using ML (random forest) activity models alone, most of the active compounds in the test set were predicted to be inactive at the default PPV levels used in GTD. For SYK activity a score cutoff corresponding to a PPV of 95% gave two true positives (TP) and 73 false negatives (FN) for the test set; a PPV of 90% gave 23 TP and 51 FN. Here, a true positive indicates an active compound (potency better than 30 nM) correctly predicted to be active, while a false negative indicates an active compound incorrectly predicted to be inactive. Reducing the PPV to 85% gave 73 TP and two FN but at the cost of a large fraction of false positives (inactive compounds predicted to be active). For the “best” compound, lanraplenib, to be assessed as “active” by the Syk model, the PPV would have had to be dropped to 88%.
Regarding the first issue, a slightly expanded AD (based on modifying the molecular fingerprint used to assess it) was sufficiently wide to pass the best of the 91 validation compounds. However, it was not wide enough to allow explorations of chemical space broad enough for the usage scenarios below where multiple chemotypes are involved. While we found productive settings for this retrospective task, it might not be trivial to do that in a prospective situation.
The second issue partially reflects a limitation of the PPV-based method for setting score thresholds. Specifically, while a threshold with a PPV of, say, 90% indicates that a molecule scoring above the threshold has an 90% chance of being active (true positive), it makes no statement about how likely a molecule scoring below the threshold is to be either active (false negative) or inactive (true negative). In practice, for generally good but not great models (cross-validated ROC score −0.85–0.93), a high PPV threshold results in large numbers of false negatives on test set data. Yet we regard this as an acceptable tradeoff if (as is typical in a drug discovery project) the goal is to find one or a small number of sufficiently good molecules for advancement, even if other potentially good molecules are overlooked.
A more serious issue with the use of ML models in molecular optimization has been raised by Renz et al. (2019). In essence, the issue can be summarized as a risk of poor prediction quality even for test molecules within a model’s nominal AD if the distribution of these molecules in chemical space differs sufficiently from that of the training molecules. (This summary is a bit of a simplification; we refer readers here for details and nuances (Renz et al., 2019).
Thus, even with the first “simple” challenge, it became evident that ML models built from the available modest-sized data sets were insufficient by themselves to meet the challenge. As a result, we proceeded to incorporate a pharmacophore model into the workflow. Figure 2 shows both drugs overlaid in the SYK binding pocket (as characterized in a co-crystal structure of entospelitinib bound to SYK, pdbID 4PUZ) which was used to create a PH4 model that captures the essential features of a potent inhibitor. (See 4puz_ento_ExVol2 pharmacophore model description in SI for complete details.)
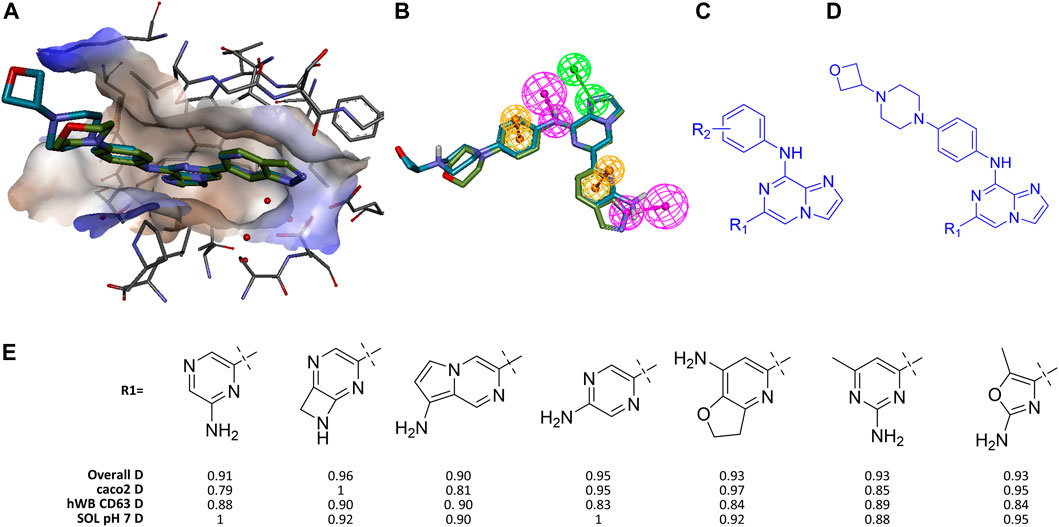
FIGURE 2. Identifying high value analogs of Entospletinib. (A) Entospletinib and lanraplenib aligned in SYK active site using pdbID 4puz and 6vov, respectively (receptor surface colored by hydrophobicity). (B) Same alignment with addition of five shared pharmacophore features (HBD magenta, HBA green, ring aromatic orange; for more detail see 4puz_ento_ExVol2 in SI). (C) Substructure constraint for first round of GTD iterations, R1 and R2 denote groups for enumeration. (D) Substructure constraint for second round of GTD iterations. (E) Representative GTD results with desirability scores.
In our initial exploration using the PH4 as the proxy for biological activity, we sought to have GTD generate molecules with the phenylamino-imidazopyrazine core shown in Figure 2C where R1 and R2 were supposed to be optimized against the PH4, a set of calculatable molecular property constraints and a few ML-models (i.e., CACO2, hWbCD63, and pH7-solubility). While GTD can produce any number of molecules the user defines, a typical run should render a few hundred ideas, a number small enough for the user to process comprehensibly. While all batches of a few hundred ideas exhibited the key features including the required HB donor feature toward Asp512 (bottom feature in Figure 2B), the aminopyrazine as the R1 of lanraplenib was not found. This should not be surprising as the chemical space for R2 was much less constrained compared to R1, such that more diversity for R2 is observed. On the other hand, all solutions for R1 exhibited the requested Hbond donor, which was a major improvement over not using the pharmacophore as additional driver.
Similar to real-word lead optimization by medicinal chemistry, we fixed R2 by using a moiety that had been found to help with solubility and stability, lanraplenib’s oxetano-piperazine (Figure 2D). However, the iterative nature of optimization in GTD means that while regions of chemical space far-separated from the starting point can be reached, the individual steps through this space are of modest size. One consequence is that if too many constraints are activated simultaneously, it is possible that no molecules pass the filter/prune step and the optimization halts. This is what we observed in our initial R1 optimization. Thus, in order to avoid premature termination of the optimization, we allowed two iterations through the GFSP cycle before activating the PH4 based filtering. This allowed the system to generate a diverse collection of R1 substructures eliminating those without the required H-bond. With this incremental activation of constraints the expected aminopyrazines were indeed generated along with other interesting molecules after five iterations. Figure 2E shows representative GTD molecules along with the overall desirability score (D) which is made up of the individual desirability functions of the employed ML-models which in this case include the permeability model (caco2 D), the solubility model (SOL pH7 D) and the human whole blood activity model (hWB CD63). Note that the PH4 model was used as a binary filter where the FitValue had to be > 0. The short list of GTD ideas shown in Figure 2E demonstrated that 1) some ideas fit the PH4 only as high-energy conformers, and 2) many ideas are close in analogs of suboptimal molecules that the team had made and abandoned (i.e., methyl-aminopyrimidine vs. failed aminopyrimidine). Nevertheless, a typical design team could triage these types of results quickly toward recognizing novel candidates with high likelihood of success. We acknowledge that other CADD workflows exist to enumerate an R-group to confer certain properties to the resulting molecule. However, those typically require a finite list of R-groups or reagents. With GTD the user is free from such restrictions.
3.2 Application of GTD to scaffold hopping
Another typical scenario for CADD design teams involves taking advantage of an existing ligand to find related ligands with improved properties. In a simple case, this might entail morphing a ligand series from a patent publication into a novel series with improved properties. To explore how this could be done with GTD, we took advantage of another two clinical SYK inhibitors, PRT-062607 and mivavotinib, (Coffey et al., 2012; Lam et al., 2016), also shown in Table 1. Figure 3A shows the two molecules as they align in the SYK active site. The shared features, i.e., the cyclohexandiamine and carboxamide hinge binding moiety, align perfectly yielding the six feature PH4 shown in the figure (the shape constraint is that of PRT-062607 alone). (See portola_6FeaSHP pharmacophore model description in SI for complete details.) We wanted to see if GTD could generate mivavotinib when given only PRT-062607 like structure as starting structure and the cyclohexandiamine moiety as a fixed atom set (see Figure 1B), the shared PH4 model without any other activity models and some other reasonable constraints. Typical results are shown in Figures 3B–D. Note that these novel examples satisfy all filters and the PH4 model, but not a single molecule exhibited a cyclized carboxamide, the hallmark of mivavotinib. Key to GTD producing mostly lactams was the introduction of the unwanted substructure filter shown in Figure 3E which eliminates all aryls with an unsubstituted carboxamide (note that a molecule like Figure 3D would still be allowed). In addition to this substructure filter, we also found that molecular property filters were helpful in keeping results near the expected chemical space (i.e., MW < 400 and number of rings ≤5).
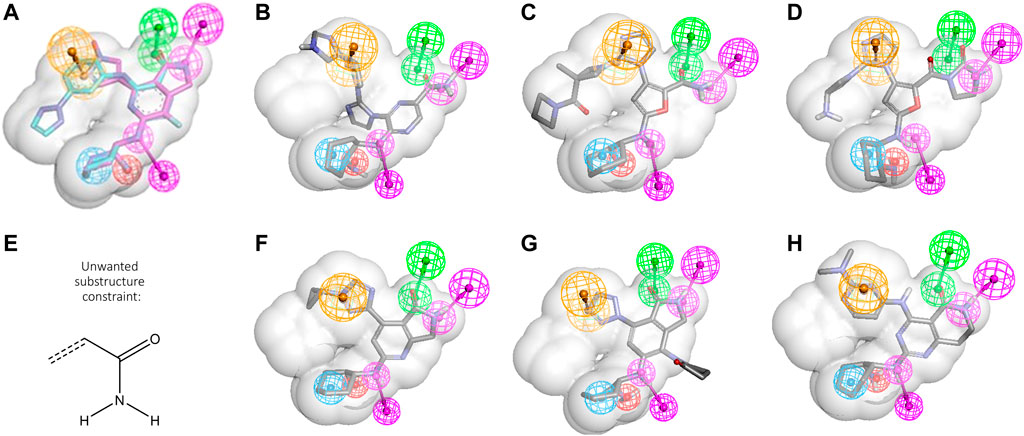
FIGURE 3. Scaffold hopping using PRT-062607 and mivavotinib. (A) PRT-062607 and mivavotinib alignment using PDBid 4rxp and 5tr6, respectively. Six common features are depicted (HBD magenta, HBA green, hydrophobe cyan, ring aromatic orange, negative charge red, for more detail see in portola_6FeaSHP SI). (B–D) Representative GTD results aligned to PH4. (E) Unwanted substructure filter. (F) Closest GTD result to mivavotinib. (G,H) Representative GTD results with cyclized carboxamide grouping.
For this case as well, adding layers of constraints gradually was essential. Specifically, constraints were activated in the following order:
1) Iterations ≥1: ML model applicability domain.
2) Iterations ≥2: Standard structural filters (bad substructure, molecular property ranges and counts).
3) Iterations ≥3: Pharmacophore FitValue >0.
4) Iterations ≥4: Custom structural filters related to unwanted chemistries.
The result was that after 14 iterations, a batch of 200 molecules contained a very close analog of mivavotinib (see Figure 3F). The other two examples (Figures 3G, H) show that GTD can find both, lactams with the direct aryl-aryl linkage of mivavotinib (Figure 3G) and the aniline linker of PRT-062607 (Figure 3H).
This lead hopping example demonstrates that GTD is an effective idea generation tool especially when the design target space is well understood and represented adequately by filters and constraints.
3.3 Application of GTD to scaffold merging
An even more common, yet more difficult scenario entails the merger of certain features of two different chemical series into a novel one with potentially improved properties. As an example, one could imagine that a SYK inhibitor design team wants to combine certain features of the entospletinib series with the unique cyclohexanediamine of mivavotinib and PRT-062607, the moiety which imbues a strong interaction with Asp512 and great solubility due to its protonated amine. Figure 4 shows the alignment of entospletinib and PRT-062607 in the active site along with their individual pharmacophoric features. Note that the interaction with Asp512 is very different between the two drugs, and even for the hinge binding region the two drugs share only the middle Hbond. By creating a hybrid PH4 (Figure 4C) using the cyclohexanediamine associated features from PRT-062607 combined with the hinge interactions of entospletinib, we focused GTD to generate hybrid molecules. A shape constraint was defined by the combined volumes of the two drugs. (See ento_portola_6FeaSHP2_tight+ExV pharmacophore model description in SI for complete details.) For our production runs, we added exclusion volumes for the protein to create harder boundaries such that GTD molecules cannot protrude beyond the shape. Like in the scaffold hopping example above, the cyclohexandiamine moiety was set to be a required 2D substructure. It should be obvious at this point that a good number of trial and error runs are required to define appropriate constraints for productive GTD use.
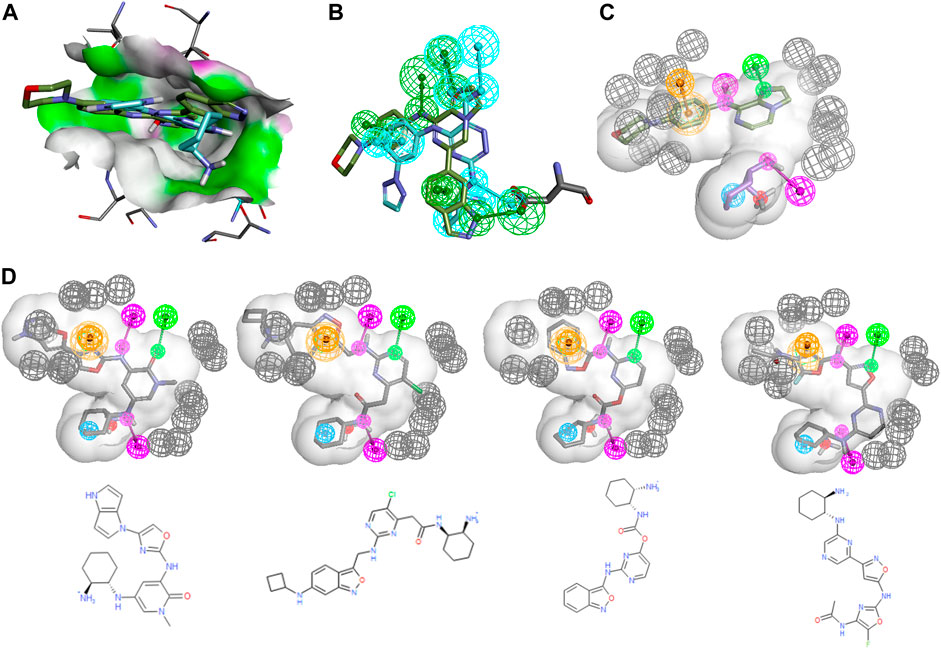
FIGURE 4. Entospletenib scaffold merging with cyclohexandiamine series. (A) PRT-062607 (cyan) and entospletinib (green) alignment using PDBid 4rxp and 4puz, respectively. Receptor surface in HBond coloring. (B) Ligands from (A) with their individual pharmacophore features (features are colored like the parent ligand). Asp512 is shown to demonstrate how ligands interact differently. (C) Hybrid PH4 with three features from each ligand (HBD magenta, HBA green, hydrophobe cyan, ring-aromatic orange, negative charge red, exclusion volumes grey, for more detail see ento_portola_6FeaSHP2_tight + ExV in SI) and the relevant part of associated ligand. Note that feature volumes had to be reduced considerably to obtain useful results. (D) Representative GTD results aligned to PH4 model along with 2D rendering.
The most successful runs used both of these molecules as starting structures and the following scheme for the gradual increase of the constraints:
1) Iterations one only: Filter to pass one molecule per common scaffold outline before PH4 fitting
2) Iterations ≥1: ML model applicability domain and pharmacophore fit score filter with FitValue >0
3) Iterations ≥2: Standard structural filters (bad substructure, molecular property ranges and counts)
4) Iterations ≥3: Custom structural filters based on insight of medicinal chemists on the design team.
In addition, we incorporated the PH4 fit score (e.g., FitValue) into the overall desirability, thus making it the main driving force in molecule evolution.
Figure 4D shows four representative examples from a GTD production run where 150 molecules were requested. Note that all of them exhibit a well-placed cyclohexanediamine along with the required hinge binding moieties. The value of these GTD results is not so much represented by these specific molecules since we have few ML-models and filter to apply, but rather the suggestion of hinge binding motifs that could be attached to the cyclohexanediamine such that all features are satisfied. A design team might just pursue simpler analogs and confirm basic biological activity and the assumed binding mode. This particular example of merging two scaffolds with GTD is a powerful demonstration of its potential for idea generation, especially in situations where ML-models do not exist to guide the iteration process.
4 Discussion
Design of novel chemical structures meeting sets of constraints relevant to lead optimization is an important way in which AI/ML, cheminformatics and simulation technologies can help drug discovery project teams achieve their goals rapidly and cost effectively. The work described here is the result of a joint effort to evaluate the utility of the GTD application in a computational chemistry context. To do this a series of scenarios were constructed to replicate typical situations faced by computational chemistry teams when working in drug discovery projects. Executing this work after the conclusion of the relevant project, obviously allows the evaluation of the output of the GTD system by a team who knows (at least one set of) structural motifs that meet the criteria, and some that do not. At the same time working across organizations allowed the team using and enhancing the GTD software to minimize “contamination” by knowledge of the expected outputs. Our three use cases covering different, yet typical scenarios in structure-based drug discovery demonstrate the utility of pharmacophore models as part of GTD to drive iterative molecule optimization. While this is demonstrated only for kinase inhibitor design, this approach should have broad utility as it is characterized by the user-dependent pharmacophore perception, not by an atom-based representation of the receptor. As this approach allows for a wide range of customizability, it is also clear that not every pharmacophore model used within the GTD system will lead to valid hits. The full potential will become clear only by broad application to diverse problems which we are currently pursuing.
Data availability statement
The data analyzed in this study is subject to the following licenses/restrictions: We used published data (cited) and unpublished SAR data used or model building. Most of the later is published in cited patent publications. Some data is proprietary to Gilead Sciences. Requests to access these datasets should be directed to uschmitz@gilead.com.
Author contributions
US, LB, JH, and MH wrote the manuscript US, VT, JC, WS, LB, JH, MH, and TD interpreted results and proposed improvements JH, LB, and TD ran in silico experiments.
Funding
This research was funded solely by Dassault Systemes and Gilead Sciences.
Acknowledgments
The authors would like to acknowledge the critical contributions of other members of the GTD software development team at BIOVIA including Kevin Merlo, Tanguy Devos, Celine Ferre, Patrice Pistone, Rajeswari Seshadri, Andrew Spong, and Romain Tertiaux. We also thank Jon Sutter and Jurgen Koska for assistance with integration of pharmacophore methods into GTD.
Conflict of interest
LB, TD, JH, and MH were employed by the company Dassault Systèmes BIOVIA. JC, WS, VT, and US were employed by the company Gilead Sciences.
Publisher’s note
All claims expressed in this article are solely those of the authors and do not necessarily represent those of their affiliated organizations, or those of the publisher, the editors and the reviewers. Any product that may be evaluated in this article, or claim that may be made by its manufacturer, is not guaranteed or endorsed by the publisher.
Supplementary material
The Supplementary Material for this article can be found online at: https://www.frontiersin.org/articles/10.3389/fddsv.2022.1074797/full#supplementary-material
References
Abel, R., Wang, L., Harder, E. D., Berne, B. J., and Friesner, R. A. (2017). Advancing drug discovery through enhanced free energy calculations. Acc. Chem. Res. 50 (7), 1625–1632. doi:10.1021/acs.accounts.7b00083
Aleksic, S., Seeliger, D., and Brown, J. B. (2022). ADMET predictability at boehringer Ingelheim: State-of-the-Art, and do bigger datasets or algorithms make a difference? Mol. Inf. 41 (2), e2100113. doi:10.1002/minf.202100113
Bender, A., and Cortes-Ciriano, I. (2021). Artificial intelligence in drug discovery: What is realistic, what are illusions? Part 1: Ways to make an impact, and why we are not there yet. Drug Discov. Today 26 (2), 511–524. doi:10.1016/j.drudis.2020.12.009
Besnard, J., Ruda, G. F., Setola, V., Abecassis, K., Rodriguiz, R. M., and Huang, X. P. (2012). Automated design of ligands to polypharmacological profiles. Nature 492 (7428), 215–220.
Blaschke, T., Arus-Pous, J., Chen, H., Margreitter, C., Tyrchan, C., Engkvist, O., et al. (2020). Reinvent 2.0: An AI tool for de novo drug design. J. Chem. Inf. Model. 60 (12), 5918–5922. doi:10.1021/acs.jcim.0c00915
Blomgren, P., Chandrasekhar, J., Di Paolo, J. A., Fung, W., Geng, G., Ip, C., et al. (2020). Discovery of lanraplenib (GS-9876): A once-daily spleen tyrosine kinase inhibitor for autoimmune diseases. ACS Med. Chem. Lett. 11 (4), 506–513. doi:10.1021/acsmedchemlett.9b00621
Bos, P. H., Houang, E. M., Ranalli, F., Leffler, A. E., Boyles, N. A., Eyrich, V. A., et al. (2022). AutoDesigner, a de novo design algorithm for rapidly exploring large chemical space for lead optimization: Application to the design and synthesis of d-amino acid oxidase inhibitors. J. Chem. Inf. Model. 62 (8), 1905–1915. doi:10.1021/acs.jcim.2c00072
Coffey, G., DeGuzman, F., Inagaki, M., Pak, Y., Delaney, S. M., Ives, D., et al. (2012). Specific inhibition of spleen tyrosine kinase suppresses leukocyte immune function and inflammation in animal models of rheumatoid arthritis. J. Pharmacol. Exp. Ther. 340 (2), 350–359. doi:10.1124/jpet.111.188441
Currie, K. S., Kropf, J. E., Lee, T., Blomgren, P., Xu, J., Zhao, Z., et al. (2014). Discovery of GS-9973, a selective and orally efficacious inhibitor of spleen tyrosine kinase. J. Med. Chem. 57 (9), 3856–3873. doi:10.1021/jm500228a
Dassault Systèmes (2022a). Biovia discovery Studio. Available at: https://www.3ds.com/products-services/biovia/products/molecular-modeling-simulation/biovia-discovery-studio/ (Accessed December 5, 2022).
Dassault Systèmes (2022b). Pipeline Pilot. Available at: https://www.3ds.com/products-services/biovia/products/data-science/pipeline-pilot/ (Accessed December 5, 2022).
Feinberg, E. N., Joshi, E., Pande, V. S., and Cheng, A. C. (2020). Improvement in ADMET prediction with multitask deep featurization. J. Med. Chem. 63 (16), 8835–8848. doi:10.1021/acs.jmedchem.9b02187
Goller, A. H., Kuhnke, L., Montanari, F., Bonin, A., Schneckener, S., Ter Laak, A., et al. (2020). Bayer's in silico ADMET platform: A journey of machine learning over the past two decades. Drug Discov. Today 25 (9), 1702–1709. doi:10.1016/j.drudis.2020.07.001
Honeycutt, J. D., Zorn, K. M., Clark, A. M., and Ekins, S. (2021). “Advances in multiobjective optimization for drug discovery and development,” in Burger's medicinal chemistry, drug discovery and development. 2. 8th ed (New York, NY, United States: Wiley).
Jespers, W., Aqvist, J., and Gutierrez-de-Teran, H. (2021). Free energy calculations for protein-ligand binding prediction. Methods Mol. Biol. 2266, 203–226. doi:10.1007/978-1-0716-1209-5_12
Kar, S., Roy, K., and Leszczynski, J. (2018). Applicability domain: A step toward confident predictions and decidability for qsar modeling. Methods Mol. Biol. 1800, 141–169. doi:10.1007/978-1-4939-7899-1_6
Lam, B., Arikawa, Y., Cramlett, J., Dong, Q., de Jong, R., Feher, V., et al. (2016). Discovery of TAK-659 an orally available investigational inhibitor of Spleen Tyrosine Kinase (SYK). Bioorg. Med. Chem. Lett. 26 (24), 5947–5950. doi:10.1016/j.bmcl.2016.10.087
Liu, D., and Mamorska-Dyga, A. (2017). Syk inhibitors in clinical development for hematological malignancies. J. Hematol. Oncol. 10 (1), 145. doi:10.1186/s13045-017-0512-1
Muratov, E. N., Bajorath, J., Sheridan, R. P., Tetko, I. V., Filimonov, D., Poroikov, V., et al. (2020). QSAR without borders. Chem. Soc. Rev. 49 (11), 3525–3564. doi:10.1039/d0cs00098a
Patel, L., Shukla, T., Huang, X., Ussery, D. W., and Wang, S. (2020). Machine learning methods in drug discovery. Molecules 25 (22), 5277. doi:10.3390/molecules25225277
Perron, Q., Mirguet, O., Tajmouati, H., Skiredj, A., Rojas, A., Gohier, A., et al. (2022). Deep generative models for ligand-based de novo design applied to multi-parametric optimization. J. Comput. Chem. 43 (10), 692–703. doi:10.1002/jcc.26826
Renz, P., Van Rompaey, D., Wegner, J. K., Hochreiter, S., and Klambauer, G. (2019). On failure modes in molecule generation and optimization. Drug Discov. Today. Technol. 32-33, 55–63. doi:10.1016/j.ddtec.2020.09.003
Selassie, C. D., Mekapati, S. B., and Verma, R. P. (2002). QSAR: Then and now. Curr. Top. Med. Chem. 2 (12), 1357–1379. doi:10.2174/1568026023392823
Sheridan, R. P. (2019). Interpretation of QSAR models by coloring atoms according to changes in predicted activity: How robust is it? J. Chem. Inf. Model. 59 (4), 1324–1337. doi:10.1021/acs.jcim.8b00825
Sheridan, R. P. (2013). Time-split cross-validation as a method for estimating the goodness of prospective prediction. J. Chem. Inf. Model. 53 (4), 783–790. doi:10.1021/ci400084k
Tang, S., Yu, Q., and Ding, C. (2022). Investigational spleen tyrosine kinase (SYK) inhibitors for the treatment of autoimmune diseases. Expert Opin. Investig. Drugs 31 (3), 291–303. doi:10.1080/13543784.2022.2040014
Tong, X., Liu, X., Tan, X., Li, X., Jiang, J., Xiong, Z., et al. (2021). Generative models for de novo drug design. J. Med. Chem. 64 (19), 14011–14027. doi:10.1021/acs.jmedchem.1c00927
Walters, P. (2022). AI in drug discovery 2020 - a highly opinionated literature review. Available at: [Internet] https://practicalcheminformaticsblogspotcom/. (Accessed December 5, 2022)
Keywords: machine learning, pharmacophore, generative compound design, desirability function, generative therapeutics design, in silico optimization
Citation: Bleicher LS, van Daelen T, Honeycutt JD, Hassan M, Chandrasekhar J, Shirley W, Tsui V and Schmitz U (2022) Enhanced utility of AI/ML methods during lead optimization by inclusion of 3D ligand information. Front. Drug. Discov. 2:1074797. doi: 10.3389/fddsv.2022.1074797
Received: 20 October 2022; Accepted: 29 November 2022;
Published: 19 December 2022.
Edited by:
José L. Medina-Franco, National Autonomous University of Mexico, MexicoReviewed by:
Rodrigo Ochoa, Boehringer Ingelheim, GermanyJose Guadalupe Rosas-Jimenez, Max Planck Institute for Biophysics, Germany
Copyright © 2022 Bleicher, van Daelen, Honeycutt, Hassan, Chandrasekhar, Shirley, Tsui and Schmitz. This is an open-access article distributed under the terms of the Creative Commons Attribution License (CC BY). The use, distribution or reproduction in other forums is permitted, provided the original author(s) and the copyright owner(s) are credited and that the original publication in this journal is cited, in accordance with accepted academic practice. No use, distribution or reproduction is permitted which does not comply with these terms.
*Correspondence: Leo S. Bleicher, leo.bleicher@3ds.com; Uli Schmitz, uschmitz@gilead.com